Carbon Footprint

The University of Basel’s recorded greenhouse gas emissions, at 6,944 t CO2-eq in 2022, were once again lower than before the pandemic. A steering committee commissioned by the President’s Board established concrete goals and measures for lowering emissions significantly in the coming years. These will be published in the spring term 2024 as the “Climate Strategy 2024–2030.”
In order to take account of the urgency of the climate crisis and to contribute to reaching the 1.5° target laid out in the Paris Climate Agreement, the University of Basel, along with its contributions in research and teaching, has been working continuously for several years on reducing its greenhouse gas emissions.
Greenhouse gas emissions 2017 - 2022
The university’s total emissions amounted to 6,811 t CO2-eq (2021) and 6,944 t CO2-eq (2022). This includes the areas of electricity, heating, cooling, grey energy from buildings, catering, waste, business travel and other energy uses.1 Emissions were again considerably lower than 2019, before the pandemic, which is largely due to the reduction in flight emissions and lower-emissions district heating mix. In 2021, the temporary simultaneous double use of the Biozentrum led to an increase in heating-related emissions. The increase in 2022 is primarily due to the renewed increase in air travel, which was responsible for nearly a third of total emissions that year.2
Climate responsibility
The University of Basel has implemented a number of important climate protection measures in recent years. With the “less for more” project, initiated in 2020, it has taken important steps toward reducing flight emissions with an aim toward achieving the university’s stated goal of a 30% reduction as soon as possible.
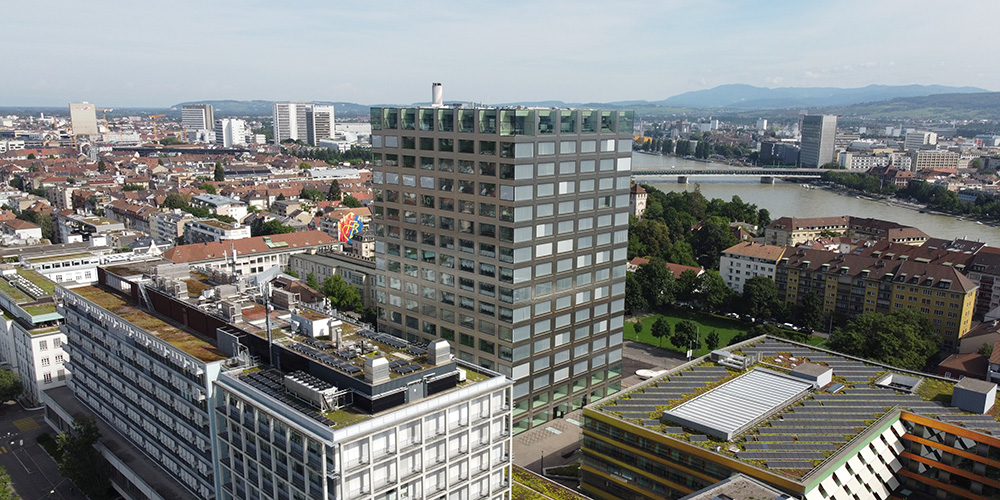
Additionally, with the enactment of the revised investment guidelines in 2022, fossil fuel plants were largely excluded from the university’s non-current investments. Other successfully implemented measures on campus, such as the reduction of goods imported by air in catering operations to under 0.2% and the installation of the photovoltaic panels on the roof of the Center for Pharmaceutical Science, underscore the university’s commitment to reducing greenhouse gas emissions. Besides these operational projects, the unique Master’s degree in Sustainable Development has prepared students for the complex challenges of climate change since 2005. Researchers in several interdisciplinary projects are also examining how to make the transition to a net-zero society possible.
Against this backdrop, in summer 2022, the President’s Board founded a steering committee consisting of representatives from various faculties and university groups to formulate recommendations for a path toward reducing greenhouse gas emissions and taking key measures to combat climate change. The President’s Board has already discussed the steering committee’s report, entitled “Climate Responsibility,” and supports the strategies outlined therein. In keeping with a "Whole Institution Approach", and based on considerations of societal impact, five high-priority action areas were defined for the university: campus and operations, mobility, research and dialog, teaching, engagement and culture. For each of these areas, ambitious but realistic goals and key measures were defined for the university to achieve by 2030. Based on the report from the steering committee, the “University of Basel Climate Strategy 2024–2030” is currently being developed and will be published during the spring term 2024.
Goals & actions
Reduce greenhouse gas emissions
Develop an implementation concept to minimize greenhouse gas emissions; set reduction targets and key measures connected to the university’s climate strategy
Sustainability Office
Infrastructure & Operations
[1] Other energy uses: use of university vehicles and laboratory gases.
[2] Deviations in total emissions for 2019-2022, compared to the data in the university's annual report, are a result from expanded carbon footprint calculations. This included grey energy in buildings, recyclables and business travel. In addition, slight data adjustments had to be made in the area of flight emissions and energy consumption.


